SOLUTION: The percent of sciences students (other than students in Mathematics and Statistics) who are doing a minor in statistics is 20%. If 300 students are selected, what is the approxima

Algebra.Com
Question 1136795: The percent of sciences students (other than students in Mathematics and Statistics) who are doing a minor in statistics is 20%. If 300 students are selected, what is the approximate probability that
A.[7] more than 150 are taking a minor in statistics? B.[5] between 40 and 70 are taking a minor in statistics? C.[6]exactly 50 are taking a minor in statistics?

Answer by Theo(13342)   (Show Source): You can put this solution on YOUR website!
using excel, i can get fairly exact probabilities.

the probability of getting a minor in statistics is .2

the probability of not doing a minot in statistics is 1 - .2 = .8

the formula for binomial probability is:

p(x) = p^x * q^(n-x) * c(n,x)

using excel i calculated the probability of x from 0 to 300 and then used excel to provide the exact answers using the binomial probability formula.

$$$

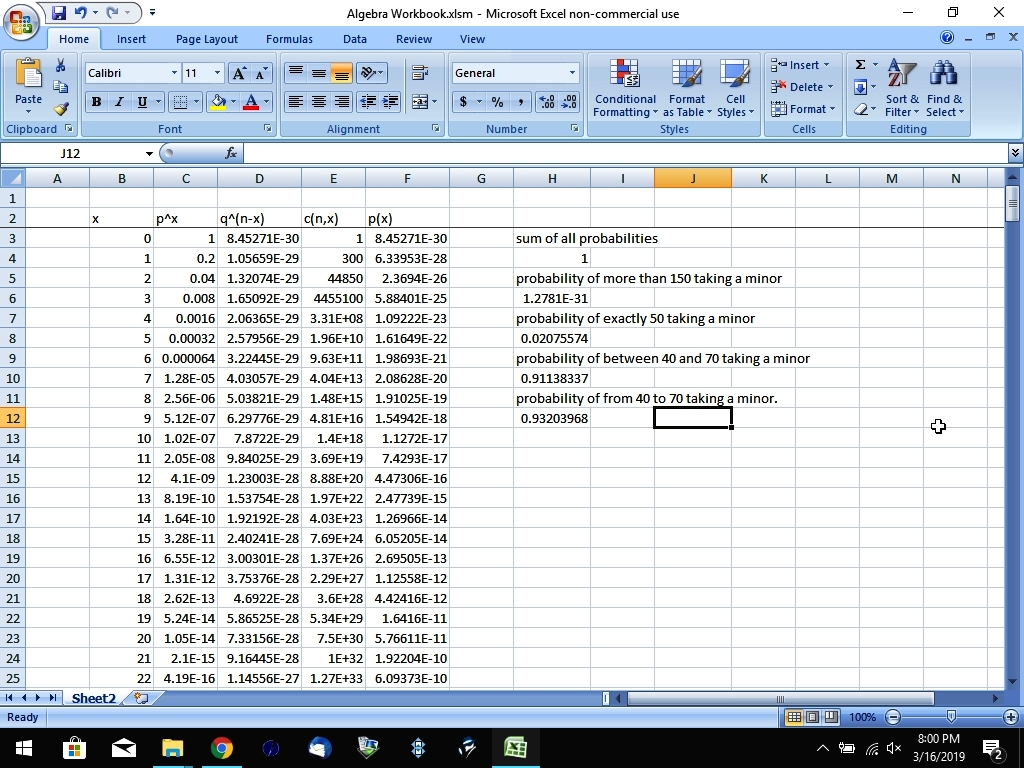
the exact answers to your problems are shown on the right.

the probability of greater than 150 taking a minor in statistics is so small that it is effectively 0, and would be if you rounded the answer to anything less than 31 decimal digits.

you can also use the normal probability tables to get a decent approximation if n * p and n * q are both greater than 10.

n is the number of trials = 300.
p is the probability of the student taking a minor in statistics = .2
q is the probability of the student not taking a minor in statistics = .8

the mean is equal to n * p = .2 * 300 = 60
the standard deviation is equal to sqrt(n * p * q) = sqrt(300 * .2 * .8) = 6.938203 rounded to 6 decimal digits.

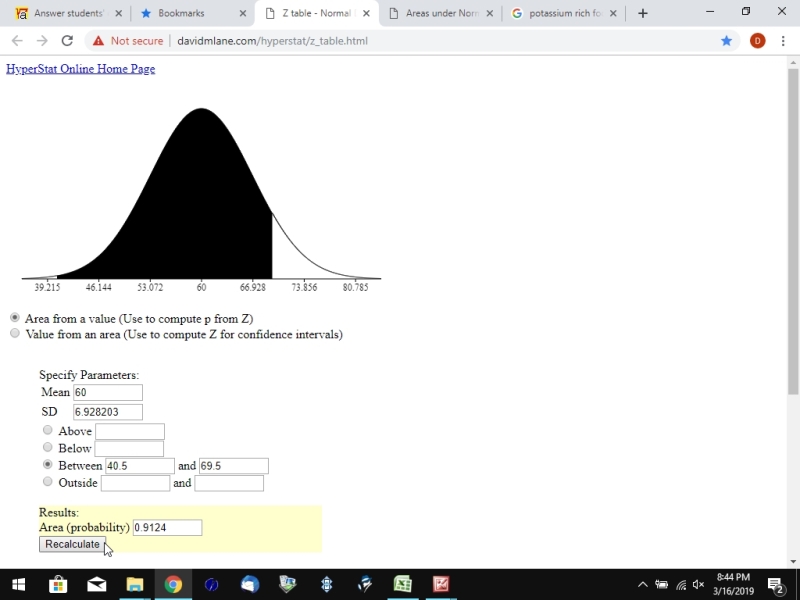
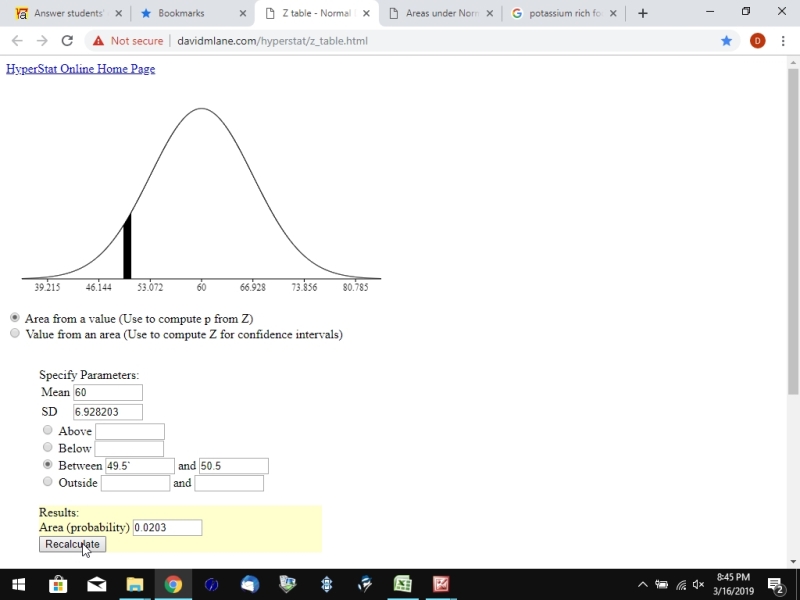
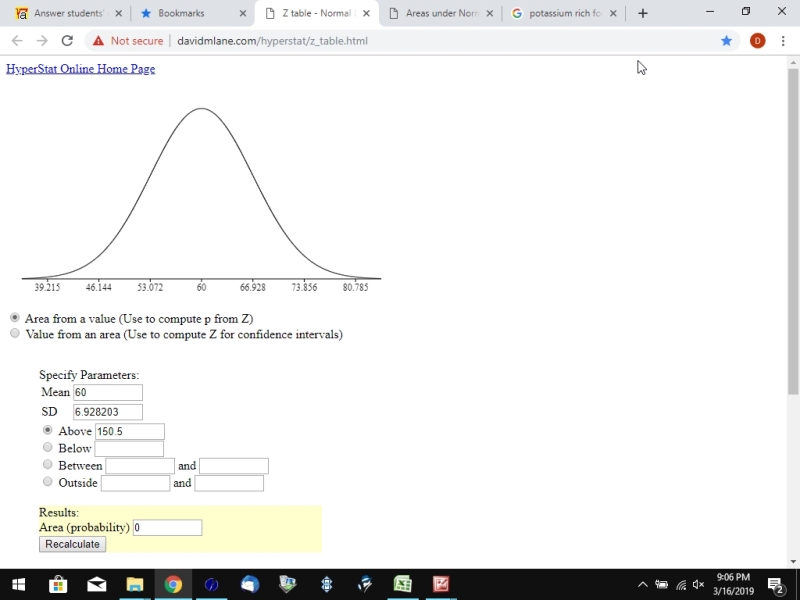
using the normal distribution calculator, you can find the normal approximation to your answers as shown below:

probability between 40 and 70..................

$$$

probability equal to 50...........................

$$$

probability greater than 150...............................

$$$

comparing the results from the normal distribution to the excel spreadsheet, i get the following:


normal distribution         excel spreadsheet         

probability between 40 and 70 ( does not include 40 nor 70):

       .9124                       .9114

probability equal to 50:

       .0203                       .0208

probability greater than 150:

       0                           0


the normal distribution approximation is not right on, but pretty close.

the normal approximation give you a reasonably close approximation if n * p and n * q are both greater than 10.

since we have 300 trials, n * p = 300 * .2 = 60 and n * q = 300 * .8 = 240, both greater than 10.


RELATED QUESTIONS

A committee of 11 members will be formed in writing a textbook in Basic Statistics which (answered by greenestamps)
65% of students in a Statistics class said that they liked Statistics more than Algebra.... (answered by jorel1380)
Let A be the event that a student is enrolled in an accounting course, and let S be the... (answered by oscargut)
A student believes that no more than 20% of the students who finish a statistics course... (answered by ewatrrr)
What is the formula for this problem: A class contains 10 students enrolled in JAVA... (answered by solver91311)
In a Statistics examination, the average score was 80 and the variance was 9. Students... (answered by Theo)
4. Thirty percent of students at a local college take statistics. Ninety percent of the... (answered by ewatrrr)
At a business college, 80 students are selected ar random. Of the 20 female, 5 will major (answered by stanbon)
In a class, half of the students took Geography while three-fifths took Statistics. If 8... (answered by ikleyn)