SOLUTION: You are given the sample mean and the population standard deviation. Use this information to construct the 90% ; 95% confidence intervals for the population mean. Interpret the res
Algebra.Com
Question 1074068: You are given the sample mean and the population standard deviation. Use this information to construct the 90% ; 95% confidence intervals for the population mean. Interpret the results and compare the widths of the confidence intervals. If convenient, use technology to construct the confidence intervals.
A random sample of
45
home theater systems has a mean price of
$140.00
Assume the population standard deviation is
$19.40
Answer by Theo(13342) (Show Source): You can put this solution on YOUR website!
A random sample of 45 home theater systems has a mean price of $140.00
Assume the population standard deviation is $19.40
population standard deviation is 19.40
sample size is 45.
standard error of the sample mean is 19.40 / sqrt(45) = 2.89198
at 90% confidence level, critical z is plus or minus 1.645.
at 95% confidence level, critical z is plus or minus 1.96.
critical raw score will be sample mean plus or minus critical z-score * standard error of the mean.
your sample mean is 140.
your standard error of the mean is 2.89198
at 90% confidence level, your critical raw score will be 140 plus or minus 1.645 * 2.89198.
that becomes 140 plus or minus 4.76 rounded to the nearest penny.
at 90% confidence level, the true population mean will be between 135.24 and 144.76.
at 95% confidence level, your critical raw score will be 140 plus or minus 1.96 * 2.89198.
that becomes 140 plus or minus 5.67 rounded to the nearest penny.
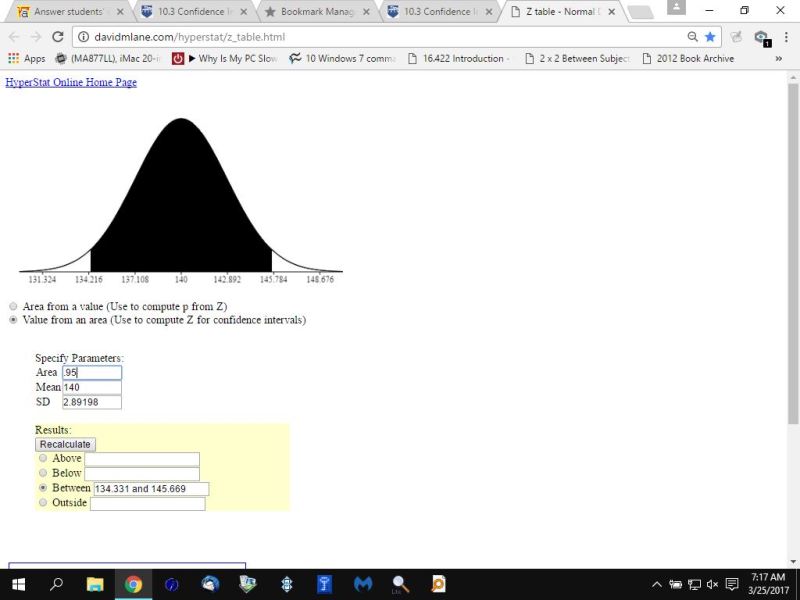
at 95% confidence level, the true population mean will be between 134.33 and 145.67.
the following statistics calculator supports these conclusions with an associated picture of the distribution curve.
http://davidmlane.com/hyperstat/z_table.html
the first 2 graphs show the critical z-scores.
the second 2 graphs show the critical raw scores.


when you're looking for z-scores, the mean is 0 and the standard deviation is 1.
for these results, when you're looking for raw scores, the mean is 140 and the standard deviation is 1.89198 which is the standard error we calculated earlier.
as you can see, when the confidence level is greater, the spread of the data will also be greater.
RELATED QUESTIONS
You are given the sample mean and the standard deviation. Use this information to... (answered by Theo)
You are given the sample mean and the population standard deviation. Use this information (answered by math_tutor2020)
You are given the sample mean and the sample standard deviation. Use this information to... (answered by stanbon)
You are given the sample mean and the sample standard deviation. Use this information to... (answered by stanbon)
You are given the sample mean and standard deviation to construct 90% and 95% confidence... (answered by stanbon)
Can someone please check to see if this is done correctly?
1. A random sample of (answered by stanbon)
You are given the sample mean and the sample standard deviation Assume the population is... (answered by CPhill)
I need some serious help please!
Find the appropriate confidence interval for the... (answered by stanbon)
A 99% confidence interval (in inches) for the mean height of a population is 65.7 < μ <... (answered by ewatrrr)