Question 1033448: Find the z-scores that bound the middle 0.80 of the normal distribution
please help I am stuck. I'm not sure if its asking to find 2 z-scores.
Found 2 solutions by Edwin McCravy, Theo:
Answer by Edwin McCravy(20056)   (Show Source): (Show Source):
You can put this solution on YOUR website!
Yes, it's asking for two z-scores, the left one will be
negative and the right one positive.  They will have the
same absolute value, since the normal curve is symmetrical
about the y-axis.


The middle 0.80 of the normal curve has 0.10 to the left of it
and 0.10 to the right of it.

If  you have a TI-83 or TI-84 calculator,

2ND VARS 3 for invNorm(.1,0,1) ENTER

Read z = -1.281551567, and by symmetry
the upper z-score is +1.281551567

Maybe you're supposed to use a normal table.

There are two kinds of normal tables in use today.

If you are using a table that has negative z values,
look in the body of the table for the closest value
to 0.10 which is 0.1003 and it occurs where z=-1.28.

If you are using a table that reads from the middle,
then look in the body of the table for the closest
value to 0.40 (one half of 0.80), which is 0.3997, and
it occurs where z=1.28.

Edwin
The middle 0.80 of the normal curve has 0.10 to the left of it
and 0.10 to the right of it.
If you have a TI-83 or TI-84 calculator,
2ND VARS 3 for invNorm(.1,0,1) ENTER
Read z = -1.281551567, and by symmetry
the upper z-score is +1.281551567
Maybe you're supposed to use a normal table.
There are two kinds of normal tables in use today.
If you are using a table that has negative z values,
look in the body of the table for the closest value
to 0.10 which is 0.1003 and it occurs where z=-1.28.
If you are using a table that reads from the middle,
then look in the body of the table for the closest
value to 0.40 (one half of 0.80), which is 0.3997, and
it occurs where z=1.28.
Edwin
Answer by Theo(13342)  (Show Source): (Show Source):
You can put this solution on YOUR website! yes it is.
the middle .80 of the distribution curve will have a lower z-score and an upper z-score bounding it.
the normal distribution curve has 100% of the area underneath it.
if you are looking for the middle 80%, then 10% will be to the left of the lower z-score and 10% will be to the right of the higher z-score.
in the following pictures:
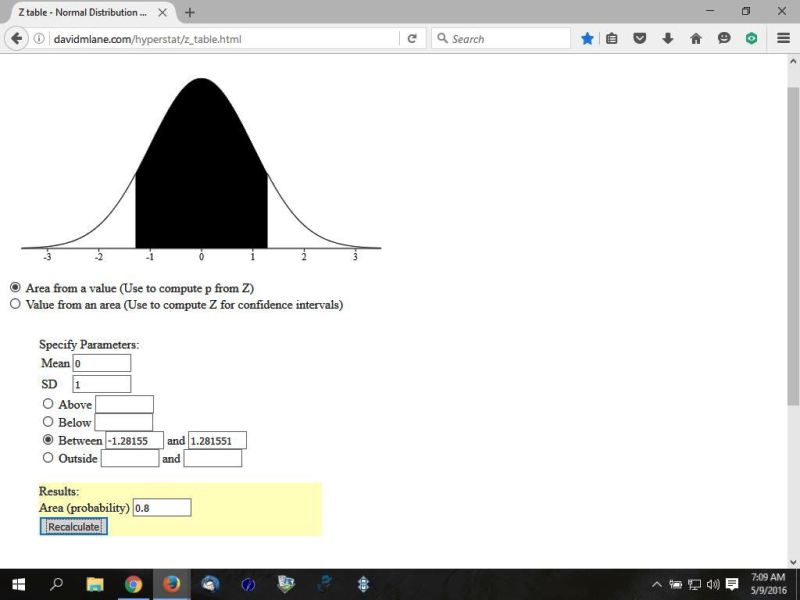
the first picture shows the shaded area in the middle equal to 80%.
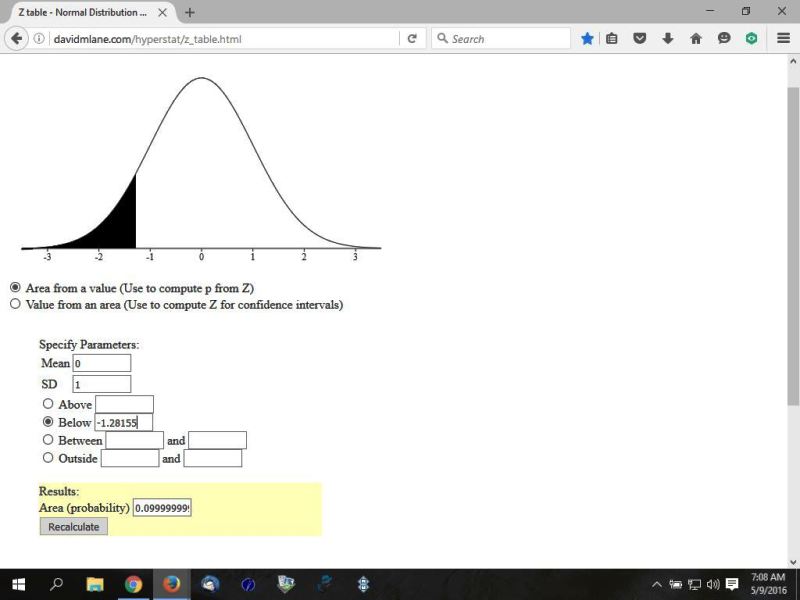
the second picture shows the shaded area to the left equal to 10%.
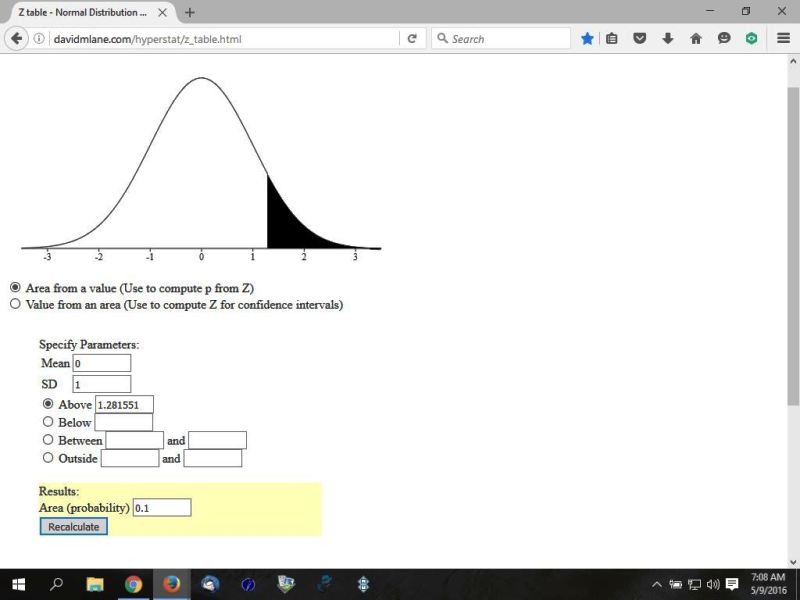
the third picture shows the shaded area to the right equal to 10%.
note that 80% = .8, and 10% = .10
note also that .0999999999 is effectively .10 once you round it.
any discrepancies are due to rounding because the inputs to the software that shows you the picture doesn't accept more than 4 or 5 decimal digits of accuracy.
here's the pictures.
look below the picture for more comments.
if you are looking for the z-score in the z-score table, the procedure would be something like this:
1 - .8 = .20.
that's the sum of the area to the left and right of the middle.
divide that by 2 to get .10
that's the area to the left and it's also the area to the right.
the simplest way to find the z-score is to find .10 in the z-score table that represents the area to the left of the z-score.
find that z-score.
in the table i used, a z-score of -1.28 shows .1003 area to the left of it and a z-score of -1.29 shows .0985 area to the left of it.
without interpolating, you would show a z-score of -1.28 since the area to the left of it is closer to .1 then the area to the left of -1.29.
if you are using a calculator, like the ti-84+, your answer would be -1.281551567.
as you can see, it's closer to -1.28 than -1.29.
since the normal distribution curve is symmetric around the mean, 10% to the left of a z-score of -1.281551567 will also give you 10% to the right of a z-score of 1.281551567.
to find that, look for an area of .9 to the left of the z-score indicated.
you will find that a z-score of 1.28 has an area of .8997 to the left of it and a z-score of 1.29 has an area of .9015 to the left of it.
you will also find that the area to the left of the z-score of 1.28 is closer to .9 than the area to the left of the z-score of 1.29.
if you use your calculator to find the area of .9 to the left of the z-score, it will tell you that the z-score is equal to 1.281551567.
you can see that in the pictures above, even though the z-score numbers have been rounded.
the z-score tablei used can be found here:
http://www.stat.ufl.edu/~athienit/Tables/Ztable.pdf
the z-score calculator that drew the pictures i showed you can be found here:
http://davidmlane.com/hyperstat/z_table.html
|
|
|