|
Question 151526: Solve the system of inequalities by graphing the solution region:
{ x+2y<_ 3
2x-3y<_6 }
Answer by jim_thompson5910(35256)   (Show Source): (Show Source):
You can put this solution on YOUR website!
Jump to Inequality #1
Jump to Inequality #2
Jump to Solution
Inequality #1
Jump to Top of the Page
 Start with the 1st inequality. Start with the 1st inequality.
 Subtract Subtract  from both sides. from both sides.
 Divide both sides by Divide both sides by  to isolate to isolate  . .
 Simplify. Simplify.
So in order to plot or (which is the same thing), we need to plot the equation  first. first.
(note: if you need help with graphing, check out this solver)
 Graph of Graph of
Now plug in a test point (0,0) into the inequality
Start with the given inequality.
 Plug in Plug in  and and 
 Evaluate and simplify. Evaluate and simplify.
Since the inequality is true, this means that we shade the entire region that contains the point (0,0)
In other words, we simply shade the entire region that is below the line.
 Graph of with the shaded region in green Graph of with the shaded region in green
----------------------------------------
Now move onto the next inequality
Inequality #2
Jump to Top of the Page
 Start with the 2nd inequality. Start with the 2nd inequality.
 Subtract Subtract  from both sides. from both sides.
 Divide both sides by Divide both sides by  to isolate . This will flip the inequality sign. to isolate . This will flip the inequality sign.
 Simplify. Simplify.
So in order to plot or (which is the same thing), we need to plot the equation  first. first.
(note: if you need help with graphing, check out this solver)
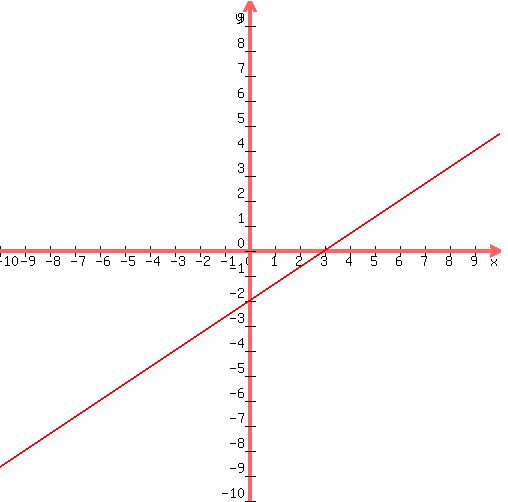 Graph of Graph of
Now plug in a test point (0,0) into the inequality
Start with the given inequality.
 Plug in and Plug in and
 Evaluate and simplify. Evaluate and simplify.
Since the inequality is true, this means that we shade the entire region that contains the point (0,0)
In other words, we simply shade the entire region that is above the line.
 Graph of with the shaded region in green Graph of with the shaded region in green
-------------------------------------------------------------------
Now draw all of the inequalities on the same coordinate system.
 Graph of the 2 inequalities and their shaded regions. Graph of the 2 inequalities and their shaded regions.
The solution region will be the intersecting region of the inequalities.
---------------------------- Solution --------------------------
Jump to Top of the Page
So the solution looks like:
 Graph of the 2 lines and the final solution region represented by a series of dots. Graph of the 2 lines and the final solution region represented by a series of dots.
| |
|
| |