SOLUTION: Please explain:
The paired data below consist of the test scores of 6 randomly selected students and the number of hours they studied for the test. Use a graphing calculator or
Algebra.Com
Question 1139077: Please explain:
The paired data below consist of the test scores of 6 randomly selected students and the number of hours they studied for the test. Use a graphing calculator or software (do not calculate by hand and do not show work) to determine the correlation coefficient? Does this indicate a good fit - why or why not?
Hours: 5,Score: 64; Hours: 10, Score: 86; Hours: 4, Score: 69; Hours: 6, Score: 86; Hours: 10, Score 59; Hours: 9, Score: 87.
correlation coefficient = ____________
Does this indicate a good fit? Yes or No
Reason:
Answer by Theo(13342) (Show Source): You can put this solution on YOUR website!
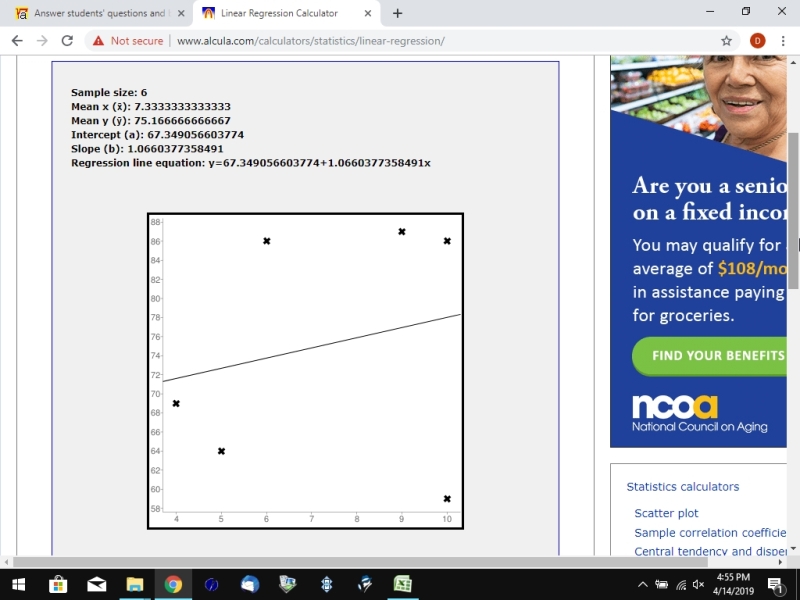
i used the following online calculator to generate the regeression line.
http://www.alcula.com/calculators/statistics/linear-regression/
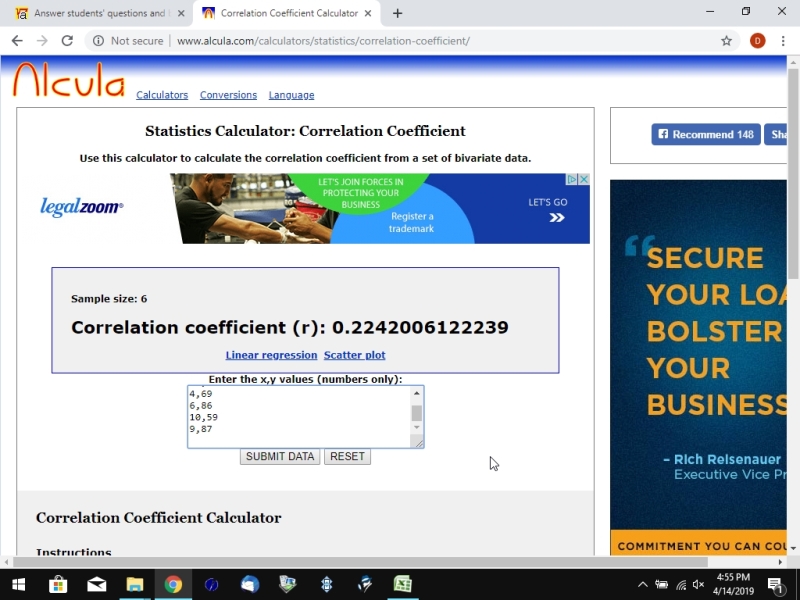
i used the following online calculator to generate the correlation coefficient.
http://www.alcula.com/calculators/statistics/correlation-coefficient/
i also used excel to generate the regression oine and get the euation and the R^2 value.

the trend line euation is y = 1.066037 * x + 67.349056 truncated to 6 decimal digits.
this will allow you to round to 5 or less decimal digits if required.
the correlation coefficient is .224200 truncated to 6 decimal digits.
that's called the R value.
the R^2 value is the R value squared.
that becomes .224200 squared = .050265 truncateed to 6 decimal digits.
that's a very low R^2 value which indicates that the data is not a good fit.
The R value is positive, so the slope of the trend line is positive, but not by a very large margin.
The R^2 value tells you how much of the can be explained by the model.
a good fit would be something with an R^2 value greater than .8 or .9.
that would tell you that the linear regression model is a go0od fit to the data and you can reasonably predict y values using the trend line equation given.
if you look at the graph, you can see that the data is not that close to the regression line, so while there is a general upward trend, your trend line values will not be that close to the actual values.
bottom line:
doesn't look like a good fit.
here's a reference on R^2.
you'll see that it can get complicated, but the general idea is that a high R^2 generally indicates that the data ia a good fir for the moddel.
https://statisticsbyjim.com/regression/interpret-r-squared-regression/
here's a reference on R.
https://www.surveysystem.com/correlation.htm
RELATED QUESTIONS
Please explain.
The paired data below consist of the test scores of 6 randomly... (answered by Boreal)
9. The paired data below consist of the test scores of 6 randomly selected students and... (answered by stanbon)
2) The paired data below consist of the test scores of 6 randomly selected students and... (answered by CPhill)
Please reveiw and explain if I have anything incorrect
The paired data below consist... (answered by Boreal)
2. The data below are the final exam scores of 10 randomly selected statistics students... (answered by lynnlo)
The data below are the final exam scores of 10 randomly selected statistics students and... (answered by ewatrrr)
The data below are the final exam scores of 10 randomly selected statistics students and... (answered by Boreal)
The following data consists of test scores and hours of preparation for 5 randomly... (answered by Fombitz)
The data given below are the final exam scores of 10 randomly selected statistics student (answered by stanbon)