when x = 0, you get 3y = -12 which results in y = -4
when y = 0, you get x = -12.
your y intercept is y = -4.
your x intercept is x = -12
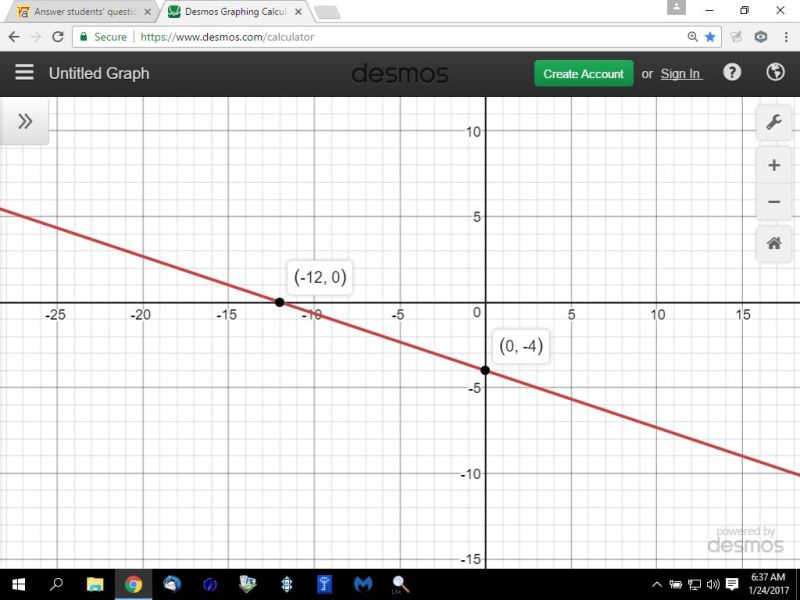
your two coordinate points are(-12,0) and (0,-4).
plot those 2 points on your graph and then draw a straight line through them.
that's your graph.
it should look like this:
an alternative method is to convert the equation to slope intercept form.
start with x + 3y = -12
subtract x from both sides to get 3y = -x - 12
divide both sies by 3 to get y = -x/3 - 12/3
simplify this to get y = -1/3 * x - 4.
this equation tells you that the slope is -1/3 and the y intercept is -4.
y intercept of -4 means that its coordinate point is (0,-4).
we solved for that earlier.
to solve for the x intercept, we need to set y = 0.
the equation becomes 0 = -(1/3) * x - 4
add 4 to both sides to get 4 = -(1/3) * x
multiply both sides of the equation by -3 to get -12 = x
x intercept of -12 means that its coordinate point is (-12,0).
we also solved for that earlier.
both methods will get you the same x and y intercepts.
once you have those, just draw a line through them and you have your graph.