SOLUTION: Write the equation in slope-intercept form. Then graph the equation. 18. 3/2x + 3/2y = 3/4 The numbers with the slashes are fractions. Thank you so much!

Algebra ->  Algebra  -> Coordinate-system -> SOLUTION: Write the equation in slope-intercept form. Then graph the equation. 18. 3/2x + 3/2y = 3/4 The numbers with the slashes are fractions. Thank you so much!      Log On

Ad: Algebra Solved!™: algebra software solves algebra homework problems with step-by-step help!
Ad: Algebrator™ solves your algebra problems and provides step-by-step explanations!


Question 120349This question is from textbook Algebra 1
: Write the equation in slope-intercept form. Then graph the equation.
18. 3/2x + 3/2y = 3/4
The numbers with the slashes are fractions.
Thank you so much!
This question is from textbook Algebra 1

Answer by jim_thompson5910(21685) About Me  (Show Source):
You can put this solution on YOUR website!
Solved by pluggable solver: Graphing Linear Equations


%283%2F2%29%2Ax%2B%283%2F2%29%2Ay=3%2F4Start with the given equation


%283%2F2%29%2Ay=3%2F4-%283%2F2%29%2Ax Subtract %283%2F2%29%2Ax from both sides

y=%282%2F3%29%283%2F4-%283%2F2%29%2Ax%29 Multiply both sides by 2%2F3

y=%282%2F3%29%283%2F4%29-%282%2F3%29%283%2F2%29x%29 Distribute 2%2F3

y=6%2F12-%286%2F6%29x Multiply

y=%28-6%2F6%29%2Ax%2B6%2F12 Rearrange the terms

y=-1%2Ax%2B1%2F2 Reduce any fractions

So the equation is now in slope-intercept form (y=mx%2Bb) where m=-1 (the slope) and b=1%2F2 (the y-intercept)

So to graph this equation lets plug in some points
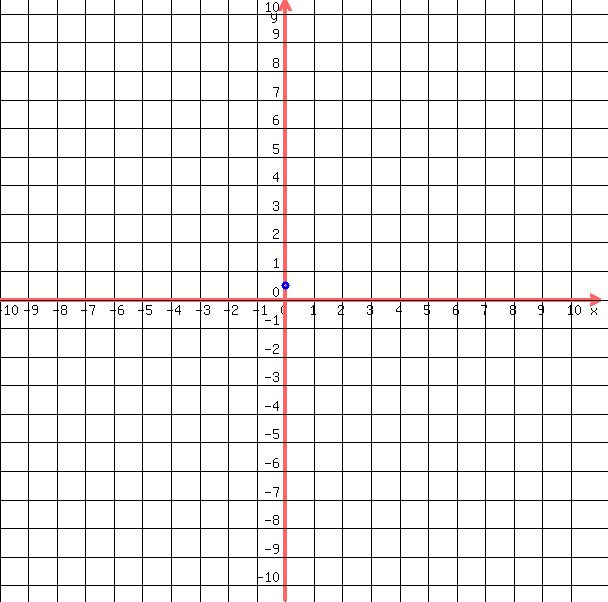
Plug in x=0

y=-1%2A%280%29%2B1%2F2

y=0%2B1%2F2 Multiply

y=1%2F2 Add

y=1%2F2 Reduce

So here's one point (0,0.5)


drawing%28+600%2C+600%2C+-10%2C11%2C+-10.5%2C+10.5%2C%0D%0A++++grid%28+1+%29%2C%0D%0A++++blue%28+circle%28+0%2C0.5%2C+.15%2C+1.5+%29%29%2C%0D%0A++++blue%28+circle%28+0%2C0.5%2C+.1%2C+1.5+%29+%29%0D%0A++%29

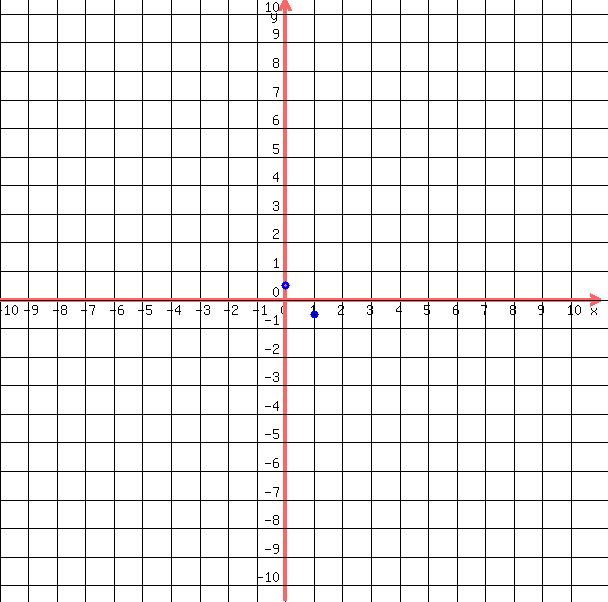
Now lets find another point

Plug in x=1

y=-1%2A%281%29%2B1%2F2

y=-1%2B1%2F2 Multiply

y=-1%2F2 Add

y=-1%2F2 Reduce

So here's another point (1,-0.5). Add this to our graph


drawing%28+600%2C+600%2C+-10%2C11%2C+-10.5%2C+10.5%2C%0D%0A++++grid%28+1+%29%2C%0D%0A++++blue%28+circle%28+1%2C-0.5%2C+.15%2C+1.5+%29%29%2C%0D%0A++++blue%28+circle%28+1%2C-0.5%2C+.1%2C+1.5+%29+%29%2C%0D%0A++++blue%28+circle%28+0%2C0.5%2C+.15%2C+1.5+%29%29%2C%0D%0A++++blue%28+circle%28+0%2C0.5%2C+.1%2C+1.5+%29+%29%0D%0A++%29


Now draw a line through these points

drawing%28+600%2C+600%2C+-10%2C11%2C+-10.5%2C+10.5%2C%0D%0A++++grid%28+1+%29%2C%0D%0A++++line%28-10-10%2C-1%2A%28-10-10%29%2B0.5%2C11%2B10%2C-1%2A%2811%2B10%29%2B0.5%29%2C%0D%0A++++blue%28+circle%28+1%2C-0.5%2C+.15%2C+1.5+%29%29%2C%0D%0A++++blue%28+circle%28+1%2C-0.5%2C+.1%2C+1.5+%29+%29%2C%0D%0A++++blue%28+circle%28+0%2C0.5%2C+.15%2C+1.5+%29%29%2C%0D%0A++++blue%28+circle%28+0%2C0.5%2C+.1%2C+1.5+%29+%29%0D%0A++%29 So this is the graph of y=-1%2Ax%2B1%2F2 through the points (0,0.5) and (1,-0.5)


So from the graph we can see that the slope is -1%2F1 (which tells us that in order to go from point to point we have to start at one point and go down -1 units and to the right 1 units to get to the next point), the y-intercept is (0,0.5) ,or (0,1%2F2), and the x-intercept is (0.5,0) ,or (1%2F2,0) . So all of this information verifies our graph.


We could graph this equation another way. Since b=1%2F2 this tells us that the y-intercept (the point where the graph intersects with the y-axis) is (0,1%2F2).


So we have one point (0,1%2F2)


drawing%28+600%2C+600%2C+-10%2C11%2C+-10.5%2C+10.5%2C%0D%0A++++grid%28+1+%29%2C%0D%0A++%0D%0A++++blue%28+circle%28+0%2C0.5%2C+.15%2C+1.5+%29%29%2C%0D%0A++++blue%28+circle%28+0%2C0.5%2C+.1%2C+1.5+%29+%29%0D%0A++%29


Now since the slope is -1%2F1, this means that in order to go from point to point we can use the slope to do so. So starting at (0,1%2F2), we can go down 1 units

drawing%28++600%2C+600%2C+-10%2C11%2C+-10.5%2C+10.5%2C%0D%0A++++grid%281%29%2C%0D%0A++++blue%28+circle%28+0%2C0.5%2C+.15%2C+1.5+%29%29%2C%0D%0A++++blue%28+circle%28+0%2C0.5%2C+.1%2C+1.5+%29+%29%2C%0D%0A++blue%28+arc%28+0%2C+0.5%2B%28-1%2F2%29%2C+2%2C+-1%2C+90%2C+270+%29+%29%0D%0A++%0D%0A++%29
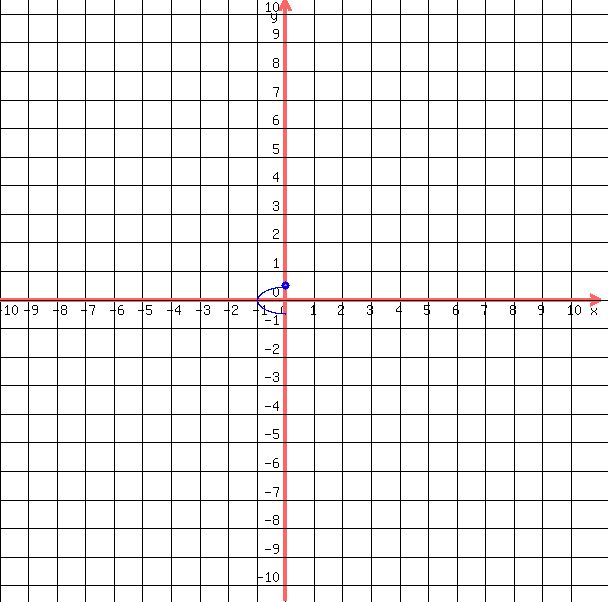
and to the right 1 units to get to our next point

drawing%28++600%2C+600%2C+-10%2C11%2C+-10.5%2C+10.5%2C%0D%0A++++grid%281%29%2C%0D%0A++++blue%28+circle%28+0%2C0.5%2C+.15%2C+1.5+%29%29%2C%0D%0A++++blue%28+circle%28+0%2C0.5%2C+.1%2C+1.5+%29+%29%2C%0D%0A++++blue%28+circle%28+1%2C-0.5%2C+.15%2C+1.5+%29%29%2C%0D%0A++++blue%28+circle%28+1%2C-0.5%2C+.1%2C+1.5+%29+%29%2C%0D%0A++blue%28+arc%28+0%2C+0.5%2B%28-1%2F2%29%2C+2%2C+-1%2C+90%2C+270+%29+%29%2C%0D%0A++blue%28+arc%28+%281%2F2%29%2C+-0.5%2C+1%2C+2%2C+0%2C+180+%29+%29%0D%0A++%0D%0A++%29

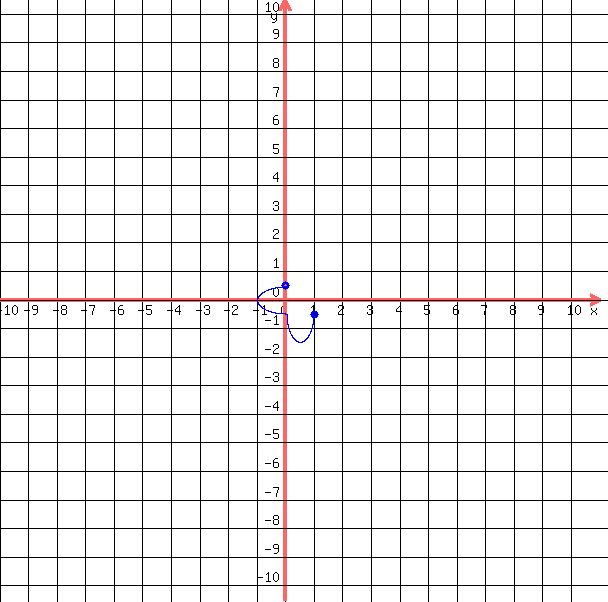
Now draw a line through those points to graph y=-1%2Ax%2B1%2F2


drawing%28+600%2C+600%2C+-10%2C11%2C+-10.5%2C+10.5%2C%0D%0A++++grid%28+1+%29%2C%0D%0A++++line%28-10-10%2C-1%2A%28-10-10%29%2B0.5%2C11%2B10%2C-1%2A%2811%2B10%29%2B0.5%29%2C%0D%0A++++blue%28+circle%28+1%2C-0.5%2C+.15%2C+1.5+%29%29%2C%0D%0A++++blue%28+circle%28+1%2C-0.5%2C+.1%2C+1.5+%29+%29%2C%0D%0A++++blue%28+circle%28+0%2C0.5%2C+.15%2C+1.5+%29%29%2C%0D%0A++++blue%28+circle%28+0%2C0.5%2C+.1%2C+1.5+%29+%29%2C%0D%0A++blue%28+arc%28+0%2C+0.5%2B%28-1%2F2%29%2C+2%2C+-1%2C+90%2C+270+%29+%29%2C%0D%0A++blue%28+arc%28+%281%2F2%29%2C+-0.5%2C+1%2C+2%2C+0%2C+180+%29+%29%0D%0A++%29 So this is the graph of y=-1%2Ax%2B1%2F2 through the points (0,0.5) and (1,-0.5)