x = number of ounces of food I
y = number of ounces of food II
These are integers such that
Table
| Food I | Food II | Total | |
| Vitamin C | 102x | 51y | 102x+51y |
| Vitamin E | 19x | 38y | 19x+38y |
| Cholesterol | 19x | 13y | 19x+13y |
The expressions in the table are due to the instructions.
For instance "Each ounce of food I contains 102 units of vitamin C" leads to 102x in the "food I" column and "vitamin C" row.
The other cells of the table are filled out in a smilar fashion.
The "total" column is the result of adding along each row.
The phrasing "at least" means "that amount or more".
It's the lowest we can go. Think of it as the floor value.
"At most" means "that's the highest we can go" i.e. "that amount or less".
Think of it as the ceiling value.
This is our system of inequalities:
The standard textbook process involves plotting each inequality on the same xy grid, and then looking to see where all of the regions overlap.
I'll take a different approach.
Let's consider this system.
where each "greater than" has been flipped to "less than" and vice versa.
Each "or equal to" is erased.
Each inequality shown above is the complete opposite of each inequality of the original system.
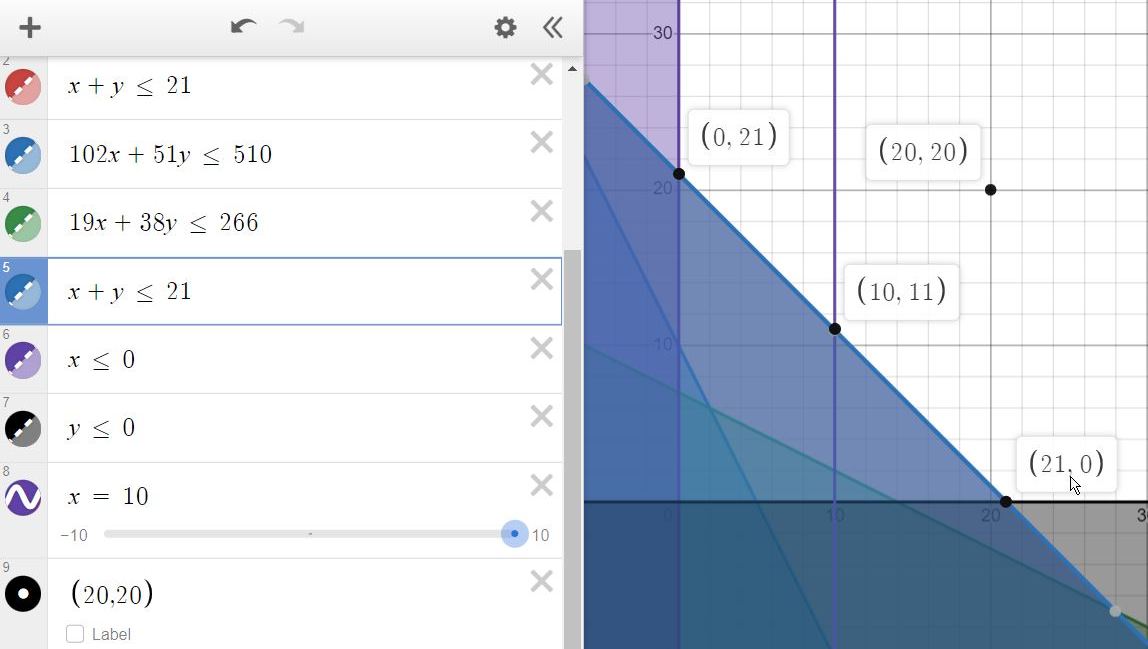
Graph this new system

Desmos link
https://www.desmos.com/calculator/ky0xk5akxk
It's a mess of shaded regions. But what isn't shaded is the graph of the original system
This is because taking the opposite means we're shading outside the solution region.
This region is a pentagon with these 5 corner points
A = (0,10)
B = (0,21)
C = (21,0)
D = (14,0)
E = (2,6)
Each corner point is determined by solving a system of two equations.
For instance, point E is determined by solving
those are the boundary line equations for
Edit: tutor @ikleyn makes a good point. I forgot to mention that the boundary of the solution is completely solid. This means points on the boundary are included in the solution set. This includes of course the corner points mentioned above.
The graph shown above has dashed lines because of the lack of "or equal to" (but remember we took the complete opposite of each inequality).
Now let's set up the objective function.
F(x,y) = amount of cholesterol
F(x,y) = 19x+13y because "Food I contains 19 units of cholesterol per ounce and food II contains 13 units of cholesterol per ounce."
Refer to the table above.
The goal is to make F(x,y) as small as possible (i.e. minimize it).
The corner points mentioned earlier are plugged into this objective function.
Point A
F(x,y) = 19x+13y
F(0,10) = 19*0+13*10
F(0,10) = 130
-----------------------
Point B
F(x,y) = 19x+13y
F(0,21) = 19*0+13*21
F(0,21) = 273
-----------------------
Point C
F(x,y) = 19x+13y
F(21,0) = 19*21+13*0
F(21,0) = 399
-----------------------
Point D
F(x,y) = 19x+13y
F(14,0) = 19*14+13*0
F(14,0) = 266
-----------------------
Point E
F(x,y) = 19x+13y
F(2,6) = 19*2+13*6
F(2,6) = 116
The results are
130, 273, 399, 266, and 116
the smallest of which is 116.
It corresponds to F(2,6).
Eating x = 2 ounces of food I and y = 6 ounces of food II gives the lowest cholesterol of 116 units.
----------------------------------------
----------------------------------------
Answer:
amount of food I: 2 ounces
amount of food II: 6 ounces
minimum cholesterol: 116 units