your variables are:
x = number of gallons of new rhythm.
y = number of gallons of crown alternate
your objective function is:
p = 2.5 * x + 4.0 * y
your constraints functions are:
x >= 30,000
y >= 15,000
x <= 80,000
y <= 40,000
.02 * x + .01 * y <= 2,000
.03 * x + .05 * y <= 2,500
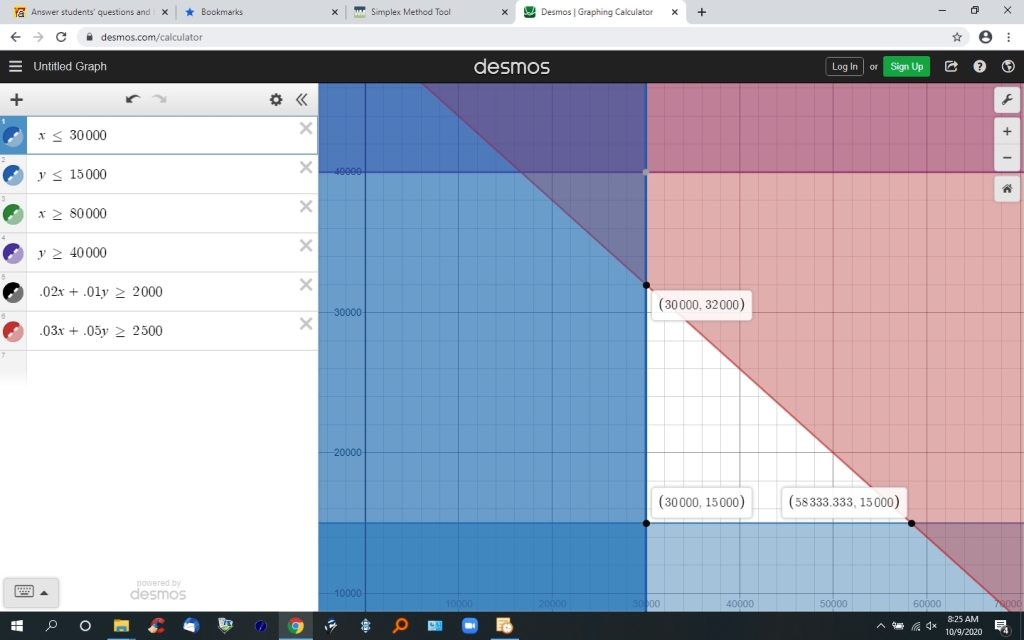
using the desmos.com calculator, you would graph the OPPOSITE of these inequalities.
specifically, you would graph:
x <= 30,000
y <= 15,000
x >= 80,000
y >= 40,000
.02 * x + .01 * y >= 2,000
.03 * x + .05 * y >= 2,500
the feasible region on the graph is the area of the graph that is NOT shaded.
your max / min solution will be at the corner points of the feasible region.
you will evaluate your objective function at each of these corner points, using the value of x and the value of y shown in the format of (x,y) on the graph.
the following table shows the points and the value of the objective function as those points.
x                  y                   2.5 * x + 4.0 * y

30,000             32,000              203,000
30,000             15,000              135,000
58,333.333         15,000              205,833.3325
the results show the maximum profit is attained when x = 58,333.333 and y = 15,000.
this means 58,333.333 gallons of new rhythm and 15,000 gallons of crown alternate are produced and sold.
all the constraints have to be satisfied as well.
when x = 58,333.333 and y = 15,000, .....
x >= 30,000 is satisfied.
y >= 15,000 is satisfied.
x <= 80,000 is satisfied.
y <= 40,000 is satisfied.
.02 * x + .01 * y = 1316.667 under 2000 is satisfied.
.03 * x + .05 * y = 2500 under 2500 is satisfied.
all the constraints are satisfied, therefore the maximum profit solution is confirmed to be good, based on the graphical analysis.